

Buildings with low rent increases near the Q103 bus in NYC
Find buildings with low rent increases near the Q103 bus corridor in NYC. This page narrows to 271+ buildings that match the “low-rent-increases” filter and are tagged for the Q103 bus route area, so you can focus on likely stability. Openigloo helps you compare buildings using renter-first signals: what current and past residents report, plus open-data indicators shown alongside each building. You can also review tenant Q&A to spot patterns before you tour or sign.
Buildings with low rent increases near the Q103 bus in NYC
Showing 1–18 of 271 buildings with low rent increases near the Q103 bus in NYC.

45-45 Center Boulevard
Hunters Point

45-40 Center Boulevard
Hunters Point

28-16 Jackson Ave
Hunters Point

43-10 Crescent St
Hunters Point
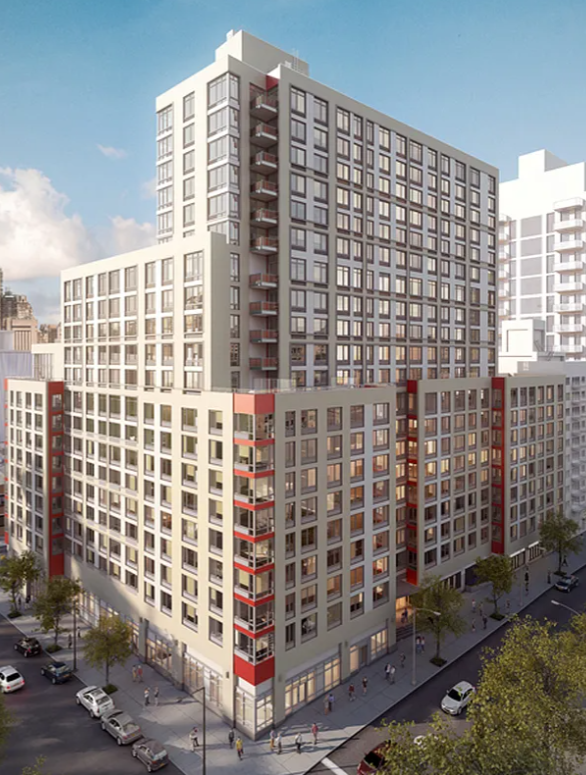
41-42 24 Street
Long Island City

43-22 Queens St
Hunters Point

4720 Center Blvd
Hunters Point

100 Dupont Street
Greenpoint

30-02 39 Avenue
Long Island City

43-25 Hunter Street
Hunters Point

21 India Street
Greenpoint
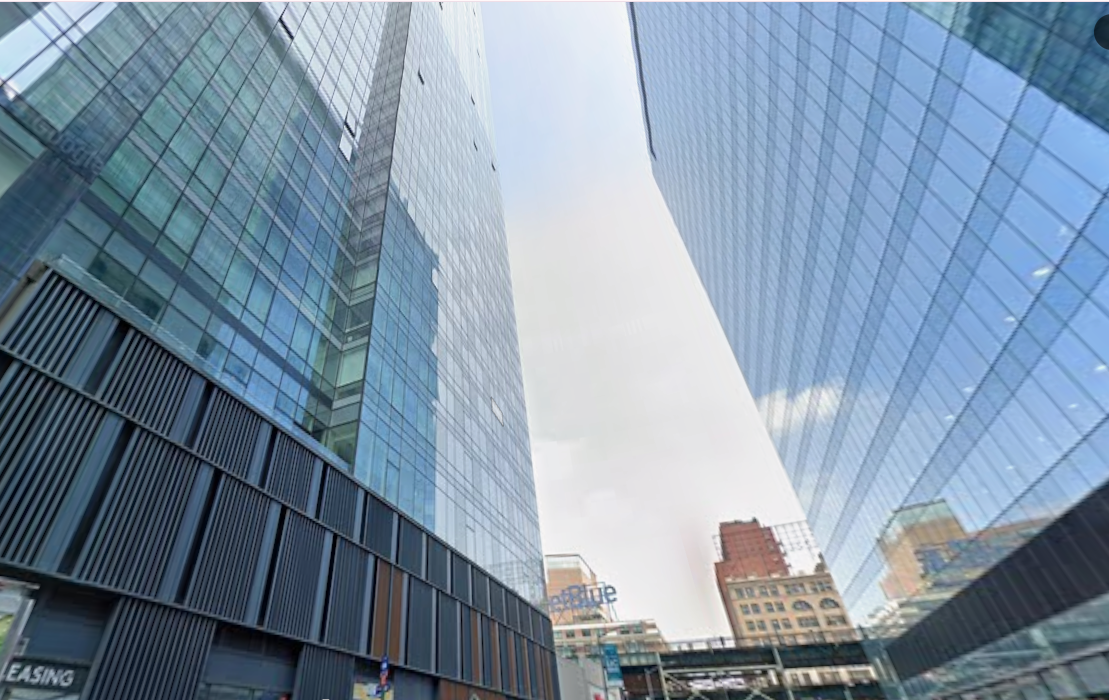
42-12 28 St
Hunters Point
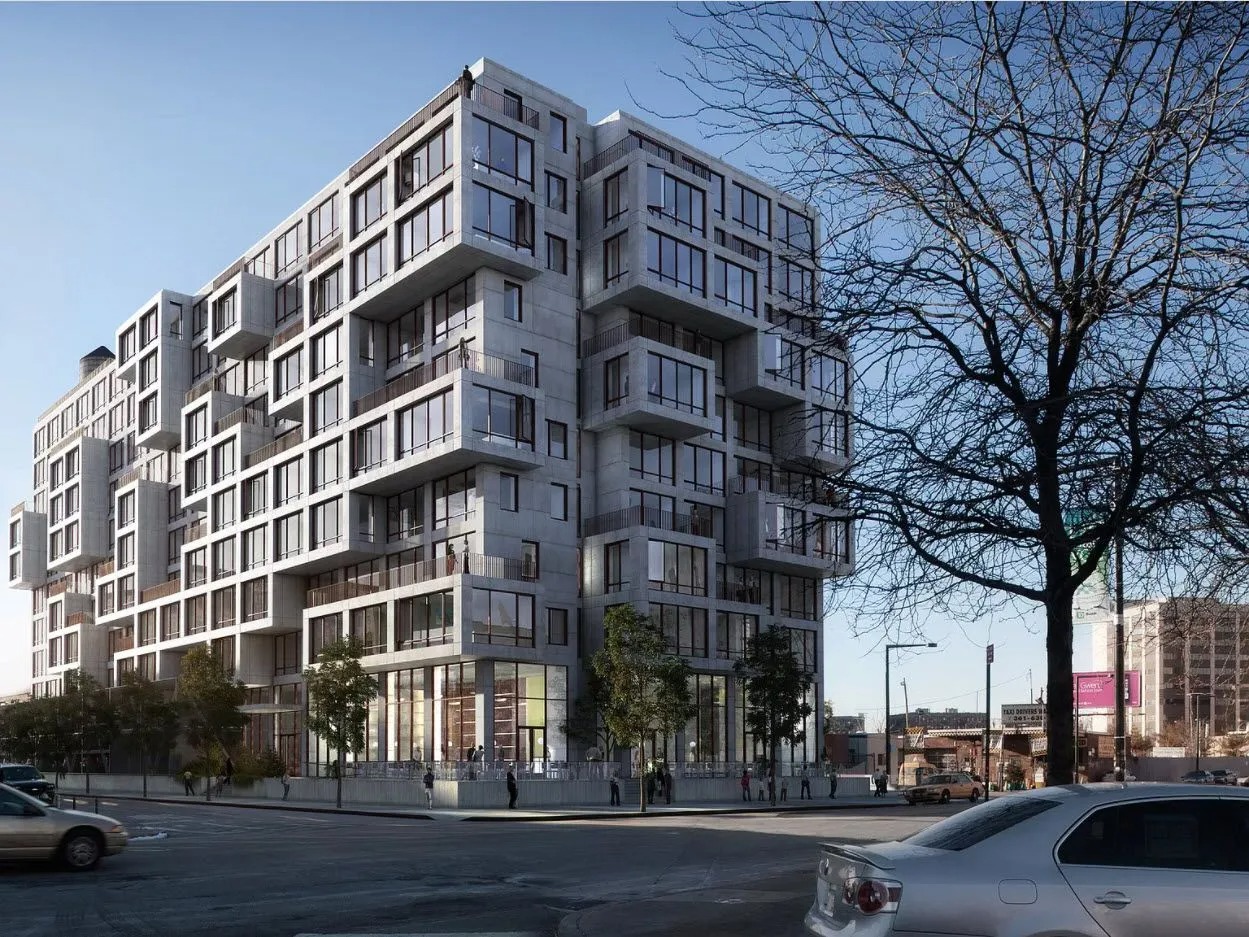
22-22 Jackson Avenue
Hunters Point
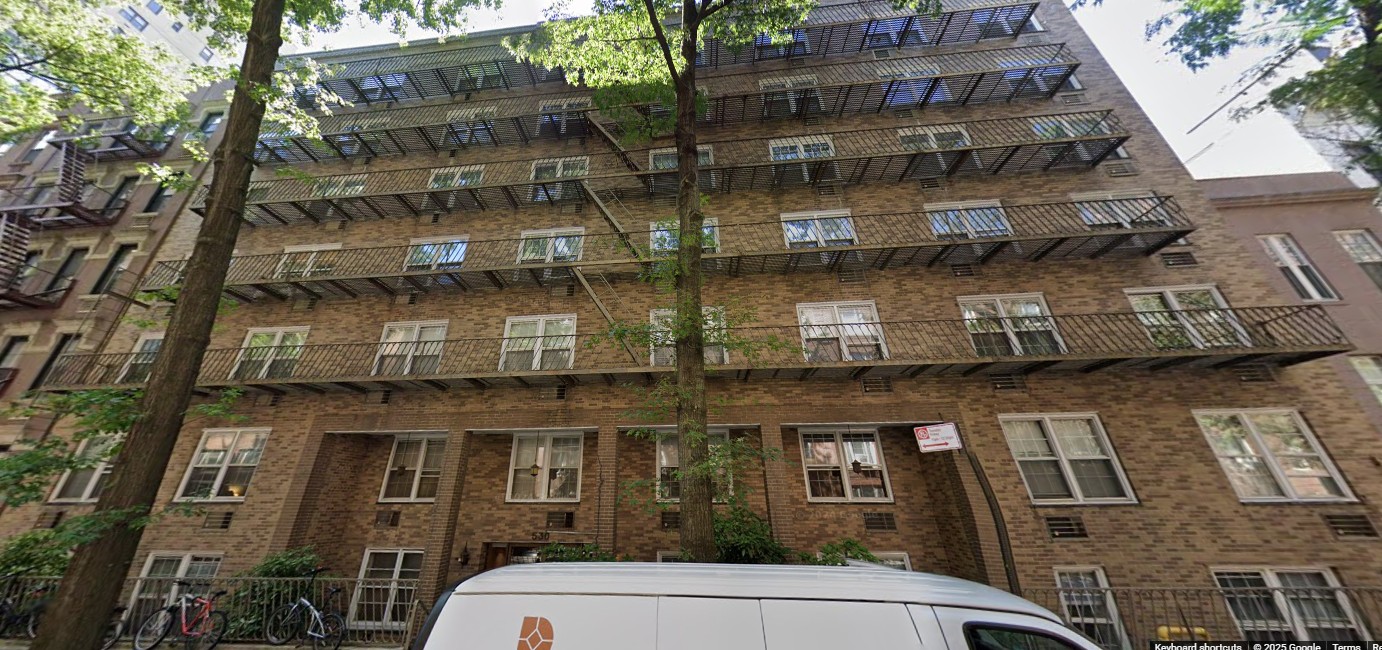
530 East 89 Street
Yorkville

29-59 Northern Blvd
Long Island City

42-22 27 Street
Hunters Point
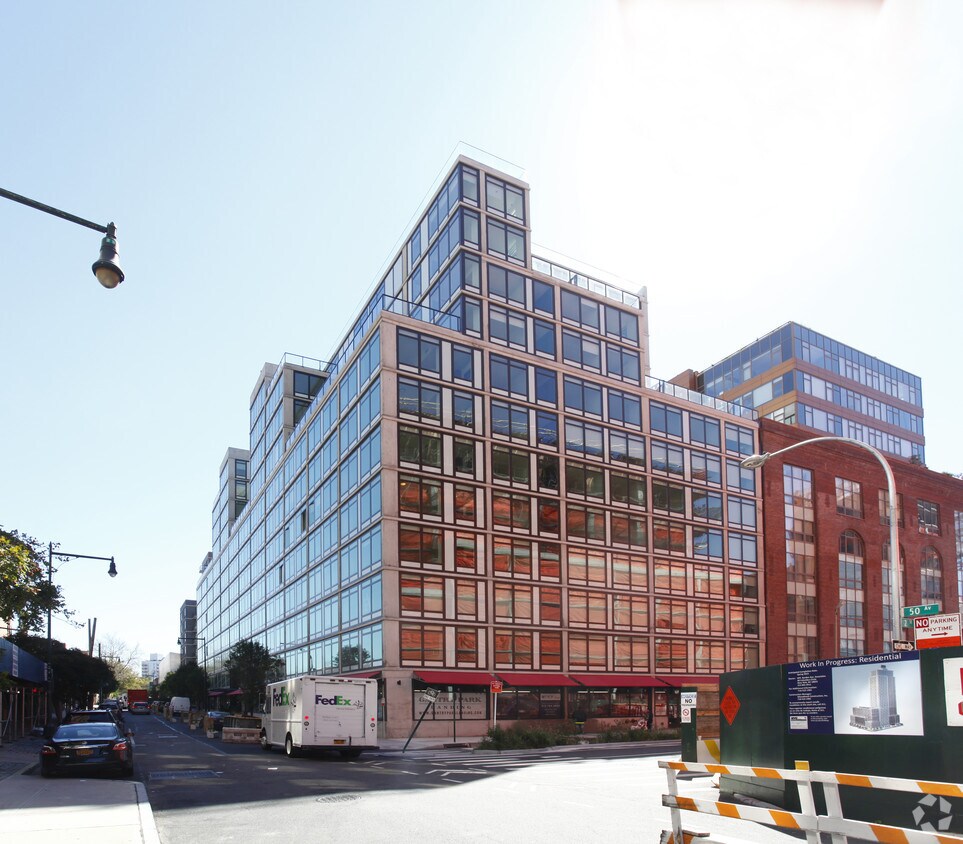
2-14 50 Avenue
Hunters Point
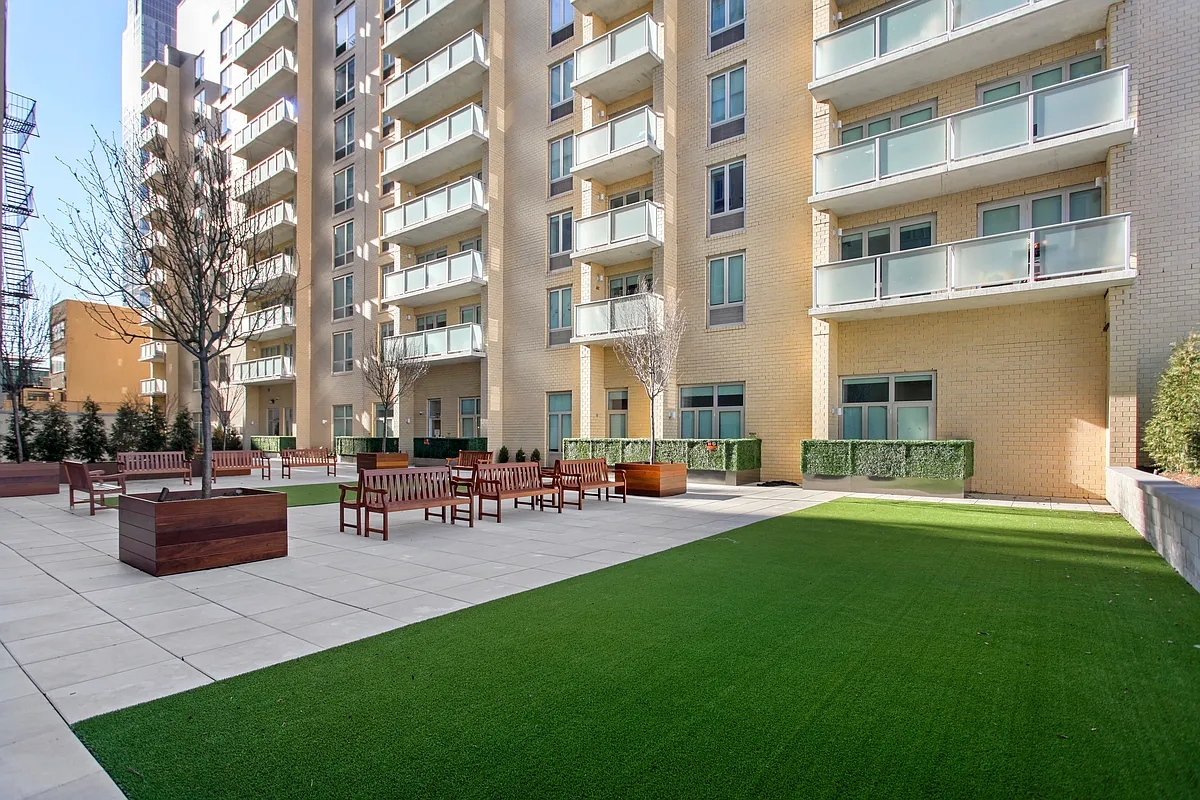
4134 Crescent St
Long Island City
What to check before choosing a building with low rent increases near the Q103 bus in NYC
- Confirm the exact bus access you care about (walk time to the stop, typical route frequency, and whether the building is on the Q103 side you expect).
- Use the “low rent increases” filter as a starting point, then verify the rent history details in your lease materials and any renewal paperwork presented by the landlord/management.
- Check what applies for your unit: preferential rent (if any), vacancy impact, and how increases work after lease renewal or re-rental.
- Before signing, ask how fees stack up beyond rent (application fees, security deposit, broker fee if applicable, and utility responsibilities).
- Read tenant Q&A and reviews for maintenance and communication patterns, not just rent figures, since service levels affect day-to-day costs and livability.